Quantities panel
Sept 15th, 2026
A number goes into a bid, and six weeks later somebody asks where it came from. Usually that isn't suspicion. The scope has moved, or a sub came in low, or an addendum landed and nobody is certain whether it touched that detail.
The answer normally lives in three places at once: a marked-up PDF, a tab in the workbook, and the estimator who built the workbook. Struction's project-wide Quantities panel puts it in one place instead. Every measured quantity in the job appears in a single list, and each one stays attached to the shape it was measured from.
WHAT IT DOES
What the panel shows you
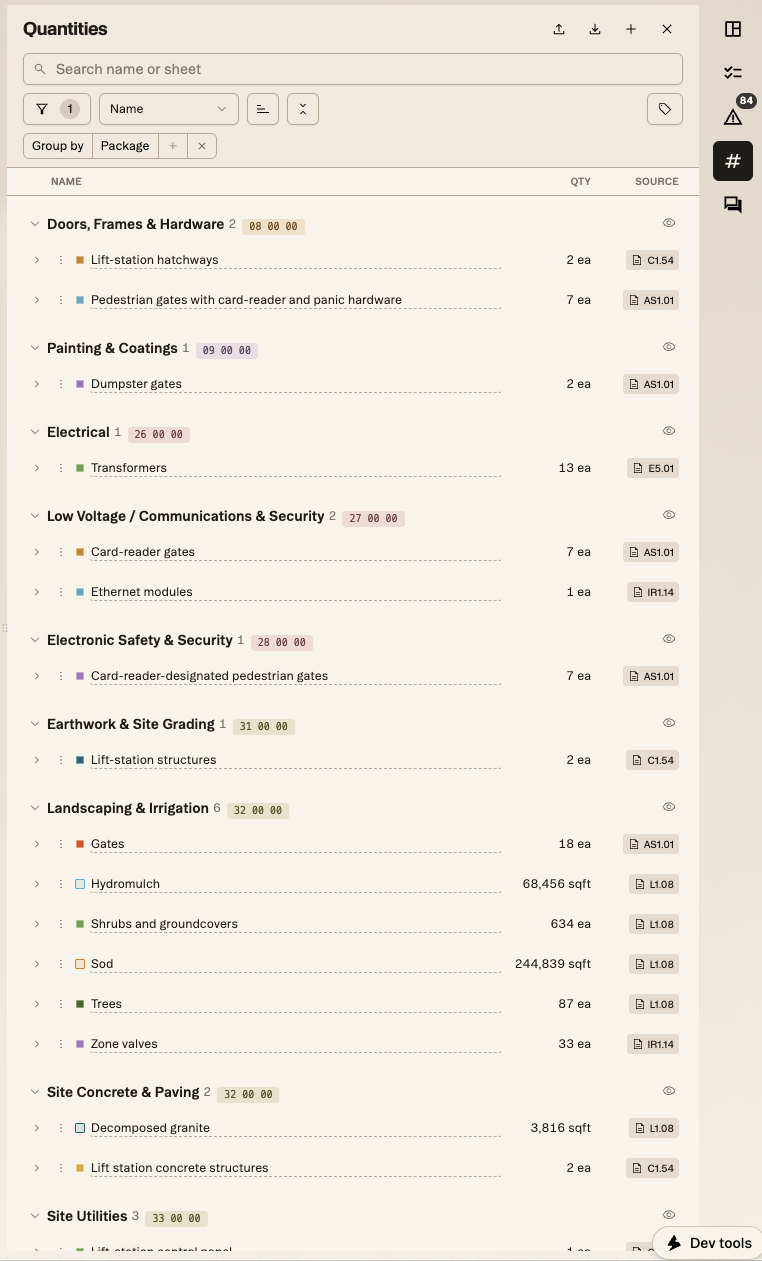
The panel opens from the toolbar and lists every quantity in the project. Each row has the name, the quantity with its unit, and the sheet it came from, so a row reads as a complete statement instead of a number you then have to go looking for.
You can group the list by package, which puts each quantity under its CSI division and lets you read the job the way your bid packages are already organized. Clicking a column header sorts by it, and clicking again reverses the order. Filters narrow the list so you can work one trade at a time instead of scrolling a whole project.
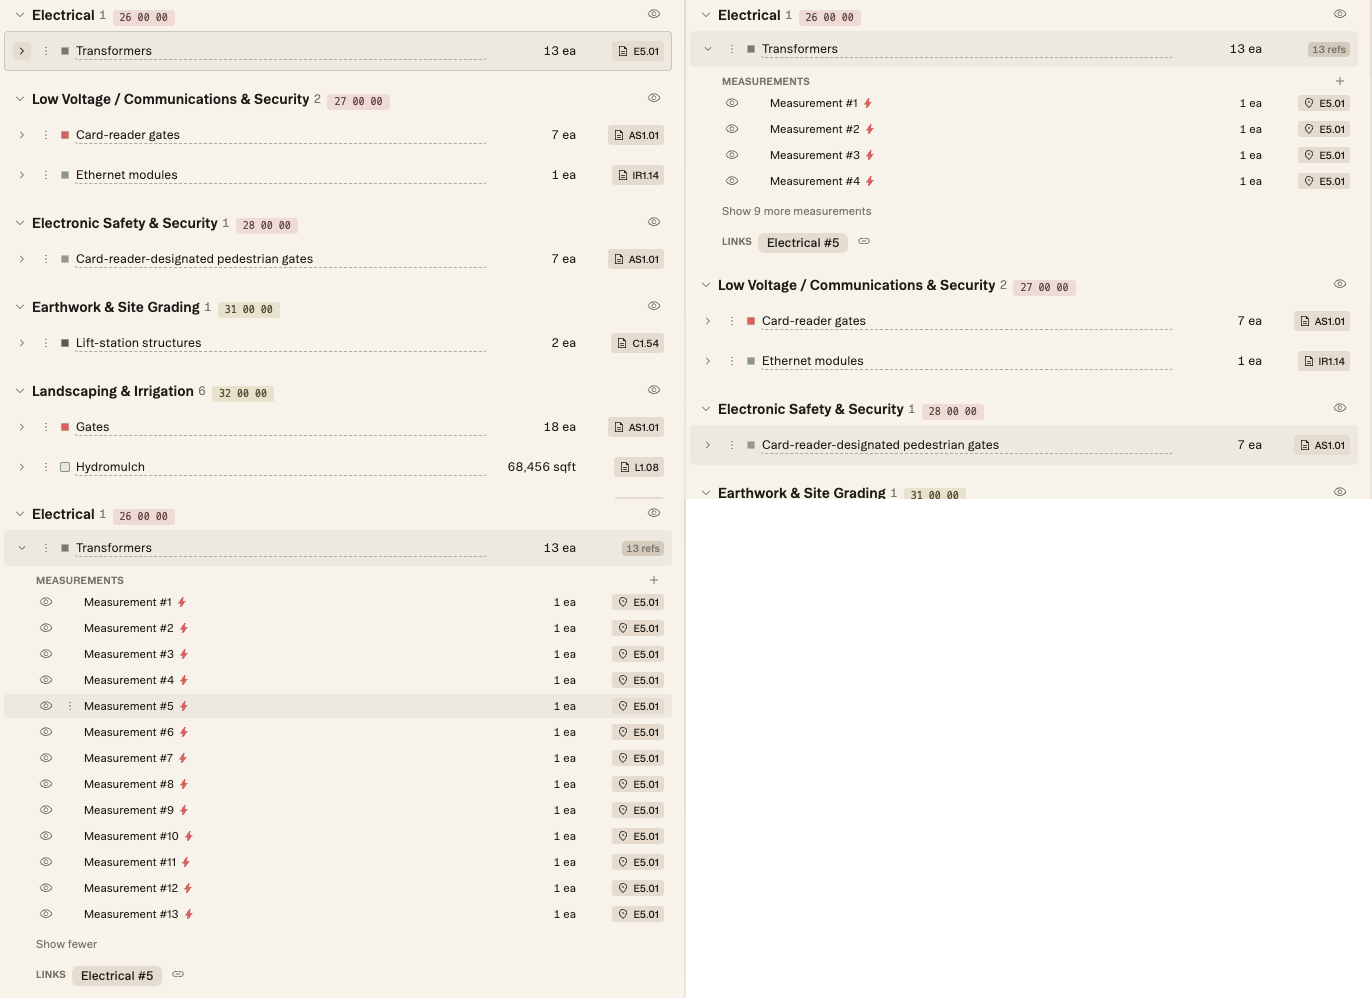
Expanding a quantity shows the individual measurements that make it up, each with its own source. A footings quantity built from four separate pours lists all four.
When you start a takeoff, the panel opens itself and scrolls to the quantity you have just created, so you aren't hunting for the row you made a moment ago.
Quantities also take tags and subtags. That came in as a customer request and it's deliberately light: enough to organize a job the way your group already talks about it, without introducing a second classification to maintain.
Quantities and measurements
It's worth being precise about the two things the panel contains, because everything else follows from the distinction.
A measurement is a single thing you drew: a run of wall, a slab area, a fixture count on one sheet. It carries its own source, because it was made against specific geometry on a specific page.
A quantity is the number that goes into the bid. It's a container holding however many measurements add up to it.
When those two collapse into one row, the source disappears with them. Once a quantity is only a figure typed into a cell, the four measurements behind it are gone, and so is the reason it reads what it reads.
Keeping them separate means a quantity can be audited without being rebuilt. You can look at the total, look at the measurements underneath it, and follow any one of them back to the sheet it was taken from.
The source column
Every quantity carries the reference it was measured from, and the panel gives that reference its own column. A sheet number sits at the end of each row, so the source is visible without opening anything.
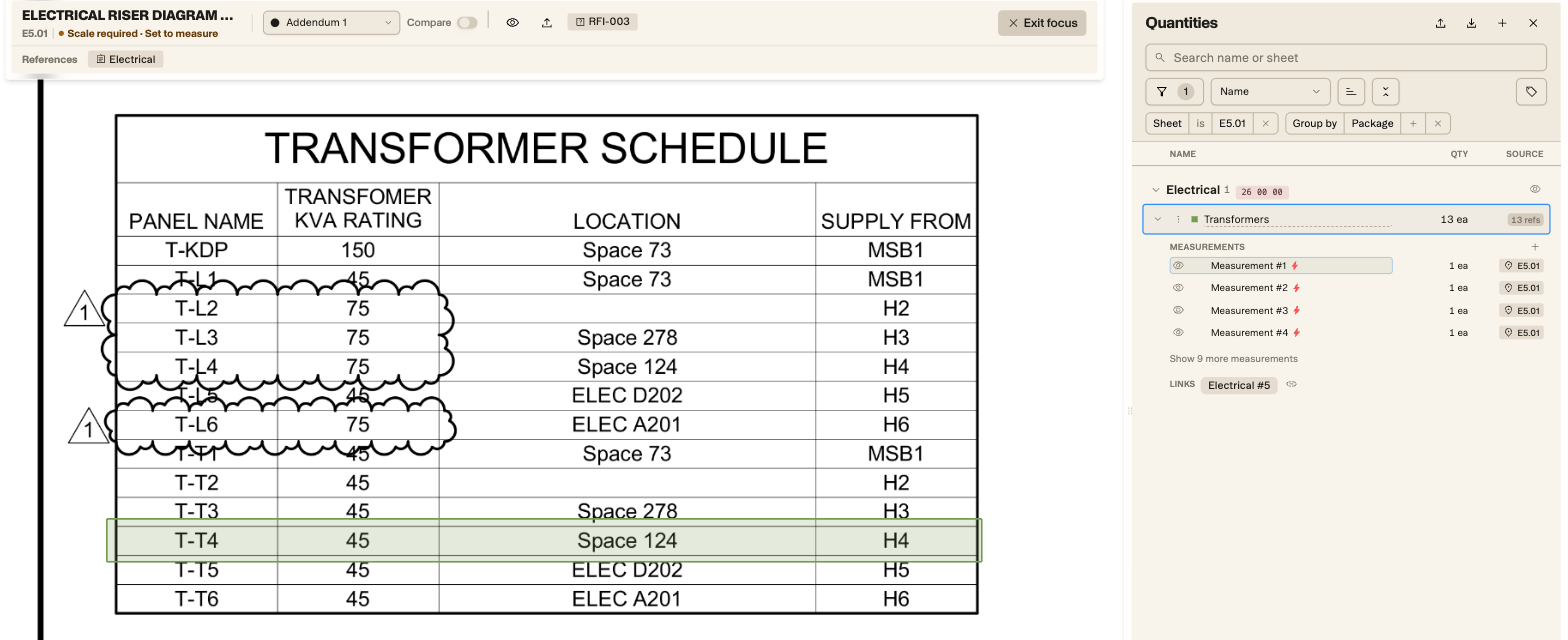
Clicking a quantity's source chip opens that sheet and filters the panel to it, so the list narrows to what was measured there. Double-clicking a measurement's chip goes one level further and zooms to the geometry itself — the schedule row or the shape the number came from, not the sheet that contains it.
Selection works in the other direction too. Clicking a shape on the drawing highlights the matching row in the panel, which is what you want when you're checking coverage instead of checking a figure.
WHY IT MATTERS
Can the number be trusted
Every estimator carries two things into a leveling meeting: the number, and the reason it's that number. The second one is rarely written down anywhere. It exists in the geometry somebody highlighted, a formula three columns over in the workbook, and a memory of a phone call about whether the canopy was included.
That reason gets asked for at three predictable moments, and they're the three least convenient ones.
The three moments
The first is the leveling meeting itself, when your number and the sub's don't agree and the room is about to settle it on whoever sounds more certain. Being able to open the sheet the quantity came from settles it on evidence instead.
The second is after award, when the argument shifts from what you priced to what you priced against: which sheet, which revision, which detail. A quantity that still points at its reference answers that question directly, where a figure in a workbook can't.
The third is when the person who built it has gone, whether that's a holiday, a new job, or another pursuit. The basis for a bid shouldn't leave the building with one person.
None of this is really a time-savings argument. The panel does save time, and that's the least interesting thing about it. What it changes is your ability to answer the question estimators are actually asked, which is whether a number can be trusted.
WORKED EXAMPLE
Walking one number back
The job below is invented, but the steps are real.
You're taking off cast-in-place footings on a foundation package. They appear on two sheets, a plan and a section detail, so you measure four separate pours across both. Struction rolls those four measurements into a single footings quantity, which the panel shows as one line with the total. Expanding it lists the four pours underneath, each carrying its own source.
One of the four is an alternate. You exclude that measurement from the sum, which drops the total to the base-bid figure while leaving the alternate visible in the list instead of deleting it from the record.
Two weeks later the sub's number arrives and the footings don't agree. You open the panel, sort by quantity, and find the footings line. Clicking its source chip moves the map to the reference, and a double-click puts you on the pours you drew.
The third pour has picked up a stepped section twice. You correct the measurement and the quantity total updates with it.
Then you export to Excel. The list comes out in the order and sort you had on screen, and lands in the workbook the bid already lives in. At no point did that sequence ask you to leave the drawings or to keep a second record of where the number came from.
HOW TO
Working the panel
- Open the panel from the toolbar. It's the # icon, alongside the takeoff tools.
- Group by package when you want to read the job by trade, and sort by clicking a column header. A second click reverses the order.
- Filter down to what you're actually checking. Working one trade at a time is considerably faster than scrolling a package running to several hundred sheets.
- Expand a quantity to see the measurements inside it. While you're building or editing one, anything holding more than a single measurement opens expanded already.
- Follow a source chip whenever a number looks wrong. One click moves the map to the reference and a double-click zooms to the quantity within it, which is the quickest way to answer where a figure came from.
- Select on the drawing to find a row in the list. Clicking a shape highlights its quantity in the panel.
- Export to Excel last, since the export follows the order and sort you have on screen. Set the view up the way you want the workbook before you run it.